
Are Stocks Attractive During Periods of High Inflation?
Executive Summary
Historically stocks have provided an effective way to protect investments from the negative impact from inflation in most periods. During periods of “high” inflation, stocks have held their own and provided more modest positive real returns. When inflation is over 3% and declining, stocks have been more likely to outperform inflation. Stock returns have been the most challenged during periods when inflation is above 10% and when inflation is above 3% and rising. If inflation continues to trend lower, historical patterns suggest stocks should be an attractive asset class. Historical observations and analysis can be a guide but is not a guarantee. Every cycle is different.
Detail
A fundamental goal of investing is to put aside money today so that it can be worth more in the future after accounting for inflation. Given the recent increase in inflation, many investors are appropriately wondering if stocks are a good investment during periods of higher inflation like we have today.
The sharp increase in the rate of inflation during 2022 clearly had a negative impact on both stocks and bond investments over the past year. Now the question is: If inflation stays high, are stocks a good place to be?
If we use history as a guide, stocks have shown themselves to be a good place to invest to protect from the negative impacts of inflation. Each cycle is different, but the average results are clear. During periods of high inflation, stock returns adjusted for inflation are lower than average, but they still have produced results that exceed inflation. This relationship holds if inflation is not above 3% and increasing or is above 10%.
There are many ways to assess the historical relationship between stock performance and inflation. Below are four different studies, each with its own unique analysis, but all reaching the same basic conclusions stated above. The studies use annual data, quarterly data, monthly data, and inflation trending data over various time periods.
Annual Data Study
First is a study that looks at annual returns from the period 1900-2011.* Measurement periods are broken down into five categories of inflation: severe, high, modest, low and deflation.
1. Severe Inflation: Years in which annual inflation exceeds 10 percent. There were 8 years out of the last 111.
2. High Inflation: Years in which annual inflation was greater than the average for post-gold linked currency exchange (1971–2011), which was 4.40 per-cent. The maximum inflation rate for the high inflation regime is 10 percent. There were 20 years out of the last 111.
3. Fed Target to Moderate Inflation: Years in which inflation was between the high end of the Fed Target (2.0 percent) and the post-1971 average (4.40 percent). There were 46 years out of the last 111.
4. Low Inflation: Years in which inflation was between zero and 1.60 percent. There were 19 years out of the last 111.
5. Deflation: Years in which prices fell. There were 18 years out of the last 111.

*Data from Professors Elroy Dimson; Paul Marsh and Mike Staunton in their book Triumph of the Optimists: 101 Years of Global Investment Returns and updated annually since then in Morningstar’s EnCorr Analyzer.
This study reveals stocks have produced positive real returns in all periods except during periods of severe inflation. “Real” returns reflect the investment performance after subtracting the rate of inflation.
The best real returns occur when inflation is moderate or lower. However, even in high inflation periods stocks have produced returns that exceed inflation, albeit by a smaller margin. When inflation becomes severe, over 10%, stocks have failed to outperform the inflation rate.
Bonds lagged stocks in all periods and produced the best relative returns vs stocks during periods of low inflations.
Quarterly Data Study
When measured using quarterly data, stocks have proven to perform the best when inflation was under 4%.** When inflation exceeds 4%, the average quarterly returns fall meaningfully as observed in the data below.
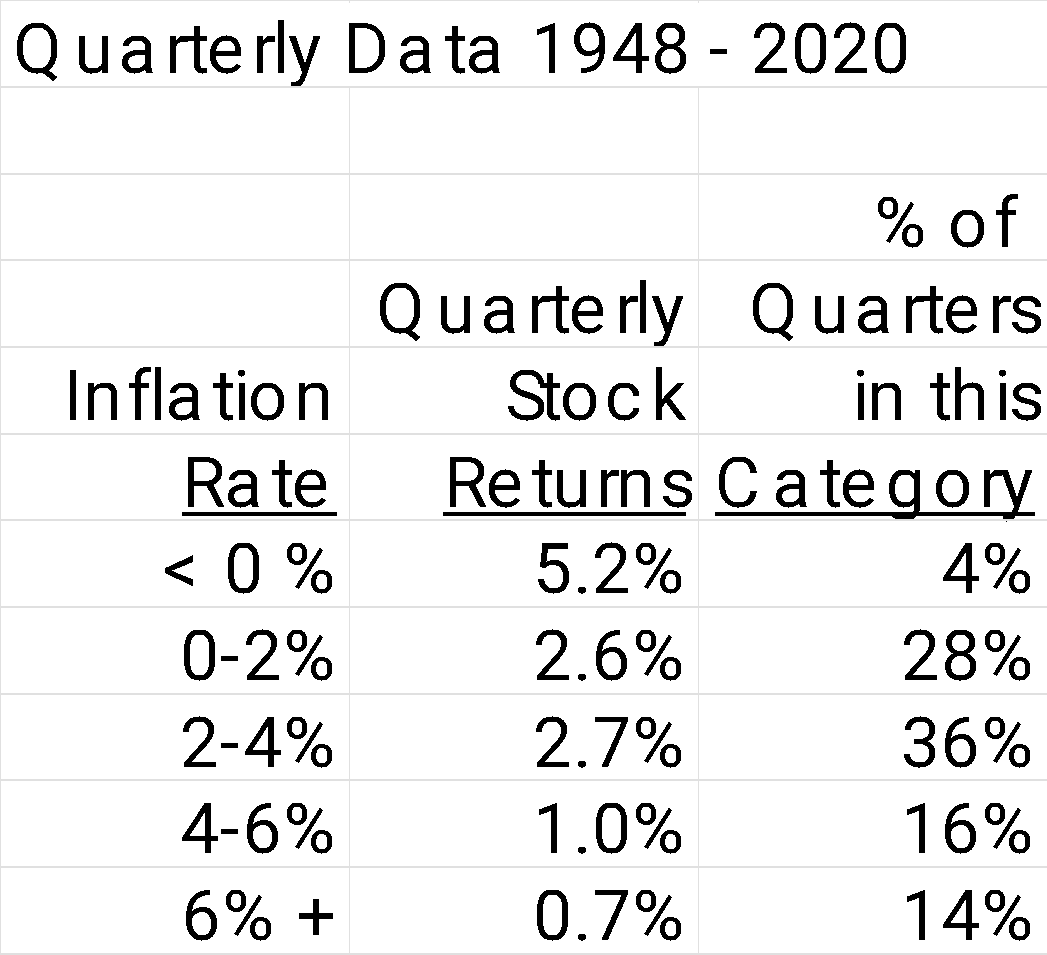
** As of December 31, 2020. Source: Federal Reserve Bank of St. Louis, S&P and AllianceBernstein.
Monthly Data Study
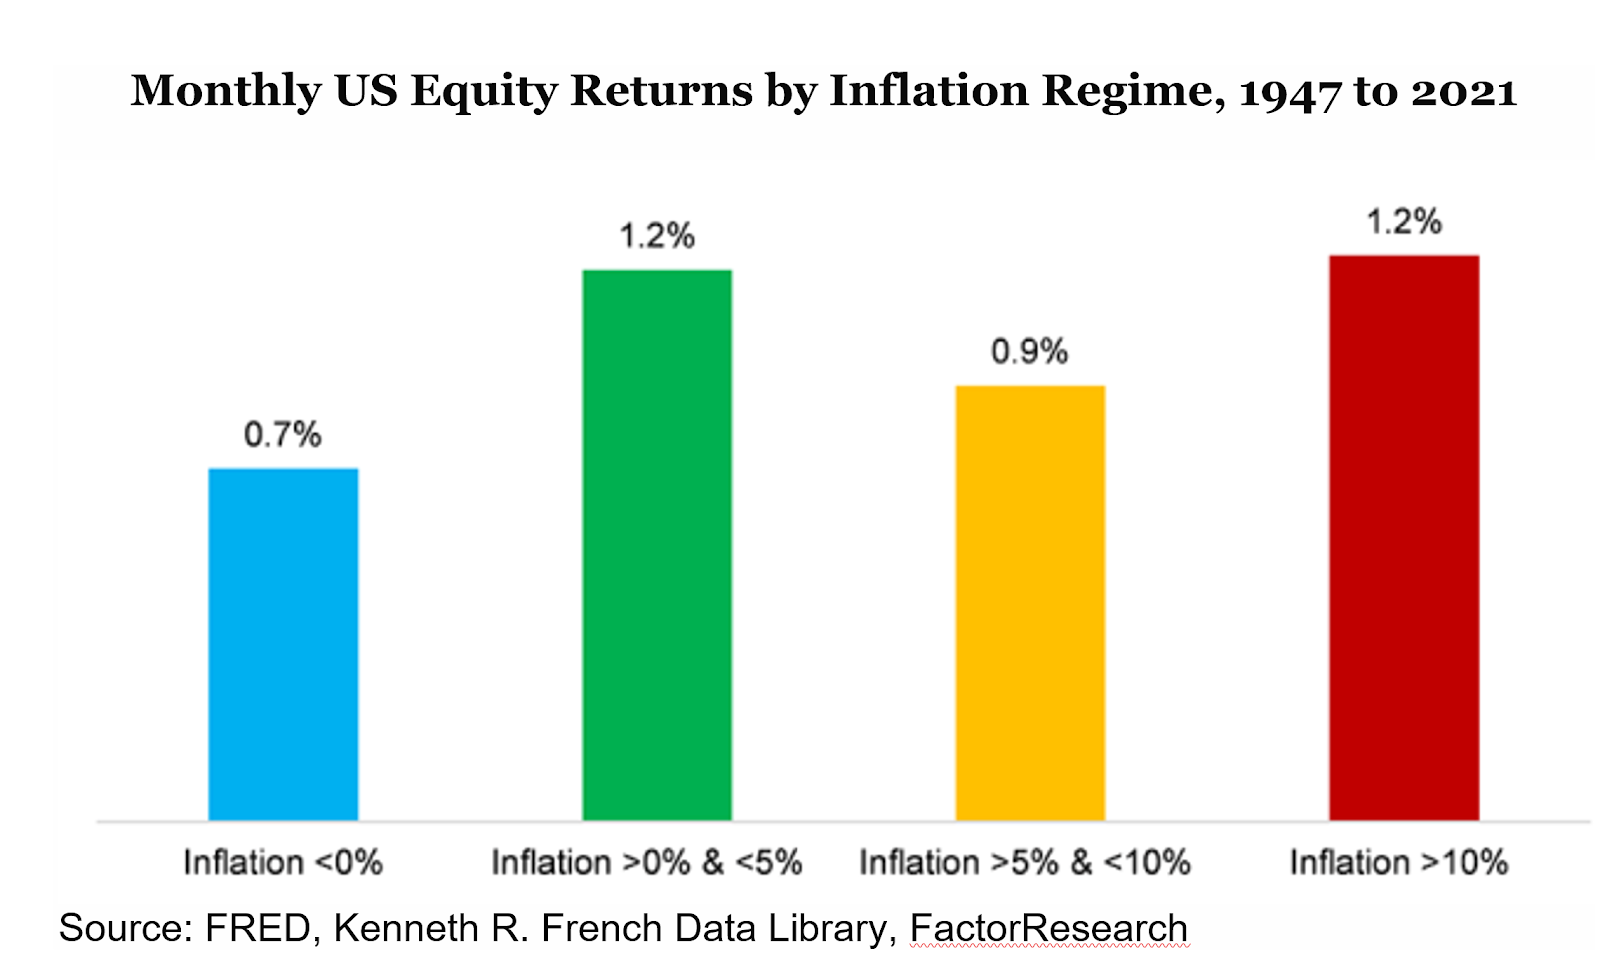
A study by Nicholas Rabner, published by the CFA Institute, supports the quarterly data analysis. This study created four inflation regimes for the 1947 to 2021 period using inflation data from the St. Louis Federal Reserve and stock market data from the Kenneth R. French Data Library.
Average monthly equity returns were comparable across these different environments. The lowest returns occurred during periods of deflation, which usually coincide with economic recessions. However, inflation above 10% did not seem to have a negative impact on stock market returns.
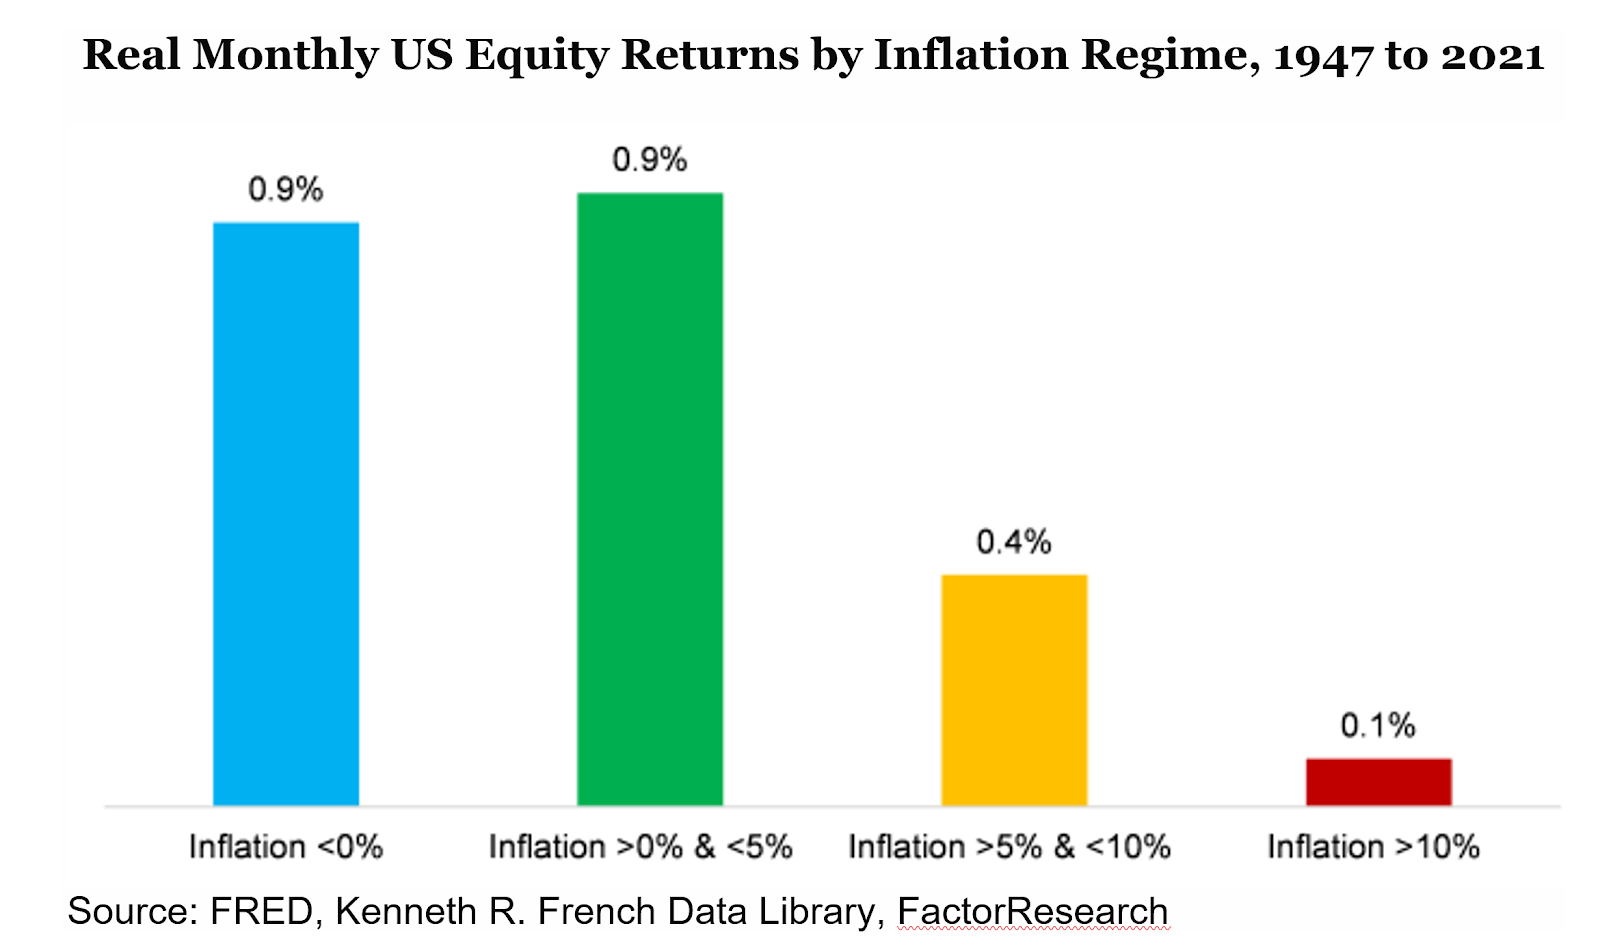
After considering the impact from inflation, the study indicates real stock returns are best when inflation is under 5%. When inflation is between 5%-10%, historic real stock returns have been about half the level as when inflation is below 5%. With inflation above 10%, real stock returns approach zero.
Inflation Trending Data Study
Lastly, we look at how stocks perform versus the rate of change in inflation.*** This study measures the rolling 12-month performance of stocks and compares it to the inflation rate during that period. Then it plots the percentage of observations where the stock performance exceeded the rate of inflation.
The data shows the 12-month rolling stock performance has exceeded the inflation rate most of the time during all periods except when the inflation rate is above 3% and is rising. (See chart below.) Importantly, when the observed level of inflation is above 3% and trending lower, like today, the rolling 12-months stock returns have exceeded the inflation rate 76% of the time.
% Of Rolling 12-Month Periods When US Equity Returns Exceeded Inflation Rate, 1973-2022
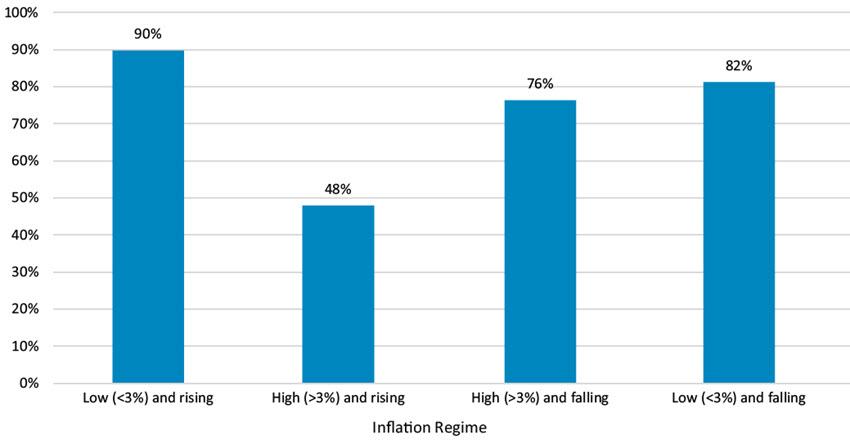
*** Investors cannot directly invest in indices. Data from March 1973–December 2022. Based on monthly 12-month returns in excess of US CPI inflation rate. Low/high inflation defined as periods when year/year % change in US CPI is below/above average over last 12 months. Rising inflation is defined as the absolute change in the inflation rate over the last 12 months. Based on MSCI USA Index. The Consumer Price Index (CPI) is a measure of change in consumer prices as determined by the US Bureau of Labor Statistics. MSCI USA Index is a free float-adjusted market-capitalization index that is designed to measure the performance of the large- and mid-cap segments of the US market. Sources: Refinitiv Datastream and Schroders, as of 12/22.